经过一段时间的整理,本期将分享认为比较常规的100个实用函数,这些函数大致可以分为六类,分别是统计汇总函数、数据清洗函数、数据筛选、绘图与元素级运算函数、时间序列函数和其他函数。
统计汇总函数
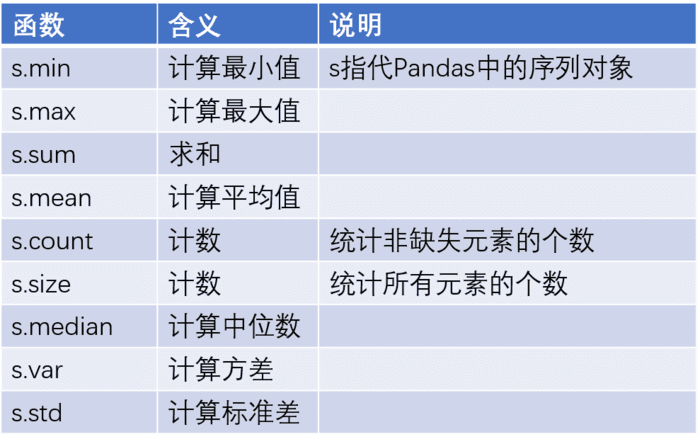
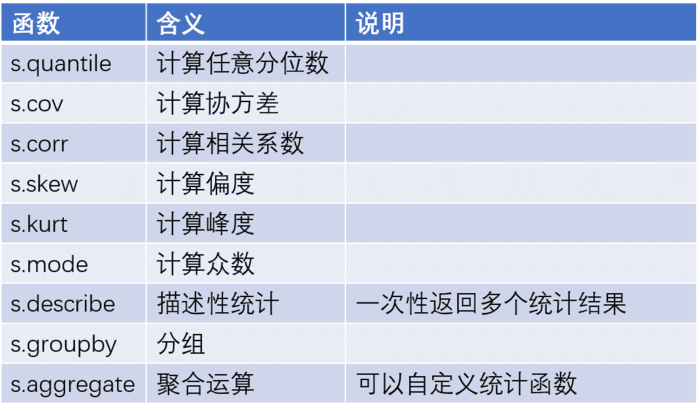
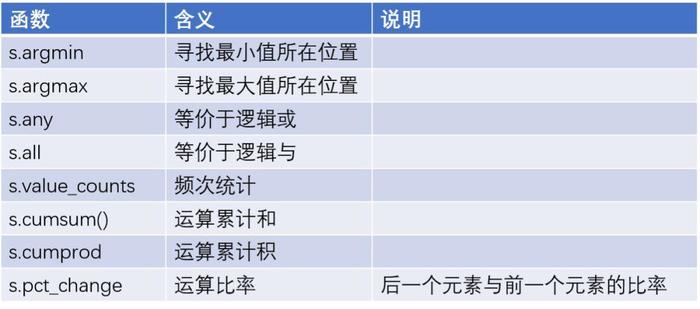
数据分析过程中,必然要做一些数据的统计汇总工作,那么对于这一块的数据运算有哪些可用的函数可以帮助到我们呢?具体看如下几张表。
importpandasaspd
importnumpyasnp
x = pd.Series(np.random.normal(2,3,1000))
y =3*x +10+ pd.Series(np.random.normal(1,2,1000))
# 计算x与y的相关系数
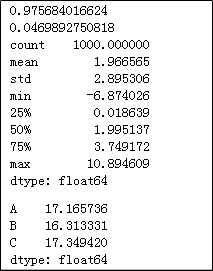
print(x.corr(y))
# 计算y的偏度
print(y.skew())
# 计算y的统计描述值
print(x.describe())
z = pd.Series(['A','B','C']).sample(n =1000, replace =True)
# 重新修改z的行索引
z.index = range(1000)
# 按照z分组,统计y的组内平均值
y.groupby(by = z).aggregate(np.mean)
# 统计z中个元素的频次
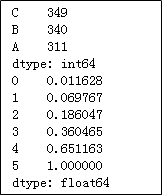
print(z.value_counts())
a = pd.Series([1,5,10,15,25,30])
# 计算a中各元素的累计百分比
print(a.cumsum() / a.cumsum()[a.size -1])
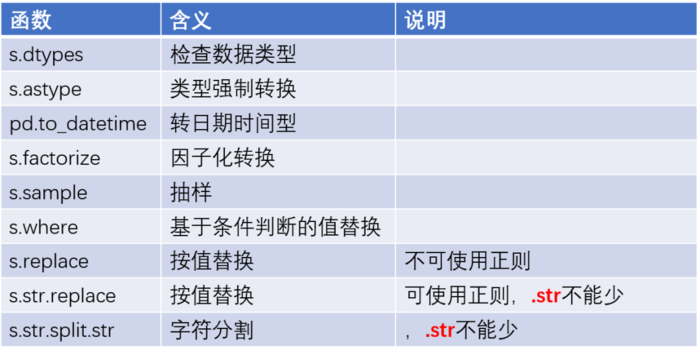
数据清洗函数
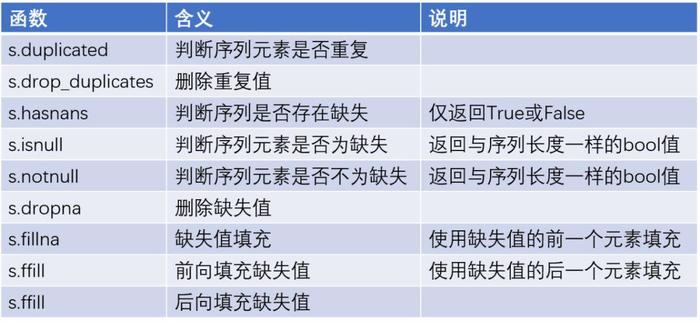
同样,数据清洗工作也是必不可少的工作,在如下表格中罗列了常有的数据清洗的函数。
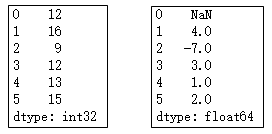
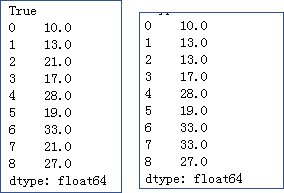
x = pd.Series([10,13,np.nan,17,28,19,33,np.nan,27])
#检验序列中是否存在缺失值
print(x.hasnans)
# 将缺失值填充为平均值
print(x.fillna(value = x.mean()))
# 前向填充缺失值
print(x.ffill())
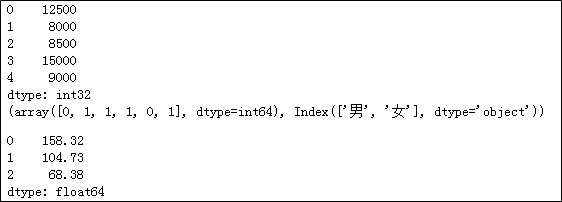
income = pd.Series(['12500元','8000元','8500元','15000元','9000元'])
# 将收入转换为整型
print(income.str[:-1].astype(int))
gender = pd.Series(['男','女','女','女','男','女'])
# 性别因子化处理
print(gender.factorize())
house = pd.Series(['大宁金茂府 | 3室2厅 | 158.32平米 | 南 | 精装',
'昌里花园 | 2室2厅 | 104.73平米 | 南 | 精装',
'纺大小区 | 3室1厅 | 68.38平米 | 南 | 简装'])
# 取出二手房的面积,并转换为浮点型
house.str.split('|').str[2].str.strip().str[:-2].astype(float)
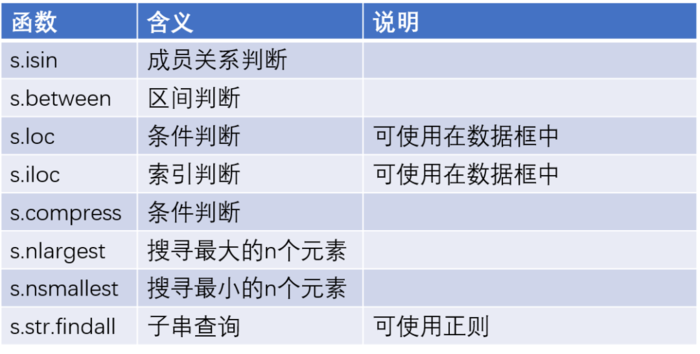
数据筛选
数据分析中如需对变量中的数值做子集筛选时,可以巧妙的使用下表中的几个函数,其中部分函数既可以使用在序列身上,也基本可以使用在数据框对象中。
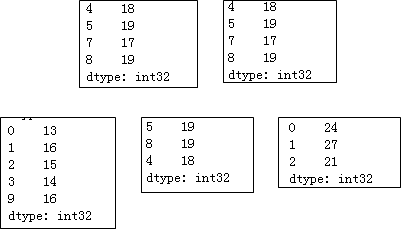
np.random.seed(1234)
x = pd.Series(np.random.randint(10,20,10))
# 筛选出16以上的元素
print(x.loc[x >16])
print(x.compress(x >16))
# 筛选出13~16之间的元素
print(x[x.between(13,16)])
# 取出最大的三个元素
print(x.nlargest(3))
y = pd.Series(['ID:1 name:张三 age:24 income:13500',
'ID:2 name:李四 age:27 income:25000',
'ID:3 name:王二 age:21 income:8000'])
# 取出年龄,并转换为整数
print(y.str.findall('age:(\d+)').str[0].astype(int))
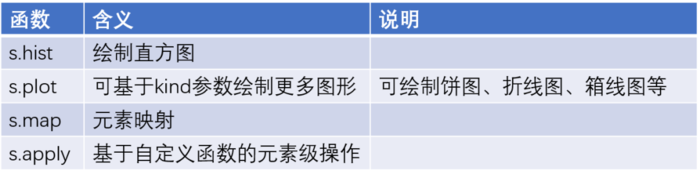
绘图与元素级函数
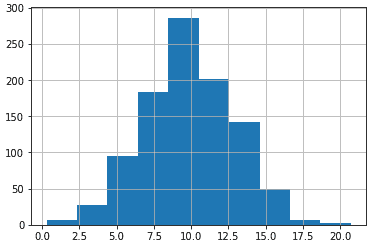
np.random.seed(123)
importmatplotlib.pyplotasplt
x = pd.Series(np.random.normal(10,3,1000))
# 绘制x直方图
x.hist()
# 显示图形
plt.show()
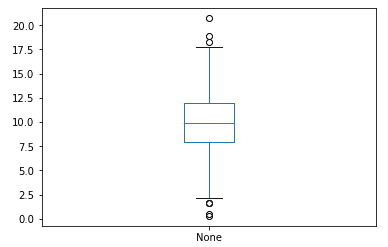
# 绘制x的箱线图
x.plot(kind='box')
plt.show()
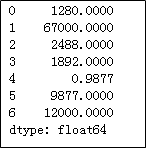
installs = pd.Series(['1280万','6.7亿','2488万','1892万','9877','9877万','1.2亿'])
# 将安装量统一更改为“万”的单位
deftransform(x):
ifx.find('亿') !=-1:
res = float(x[:-1])*10000
elifx.find('万') !=-1:
res = float(x[:-1])
else:
res = float(x)/10000
returnres
installs.apply(transform)
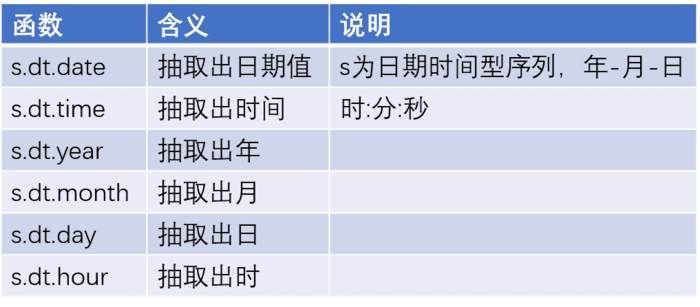
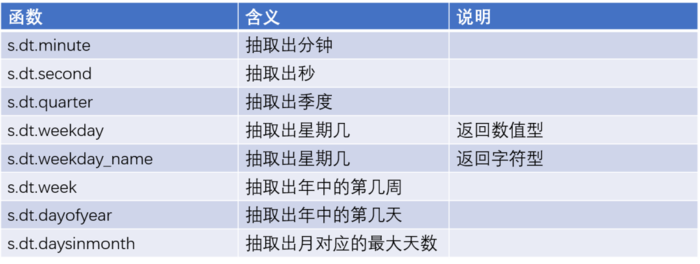
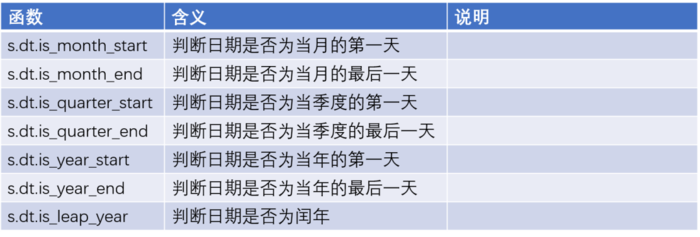
时间序列函数
其他函数
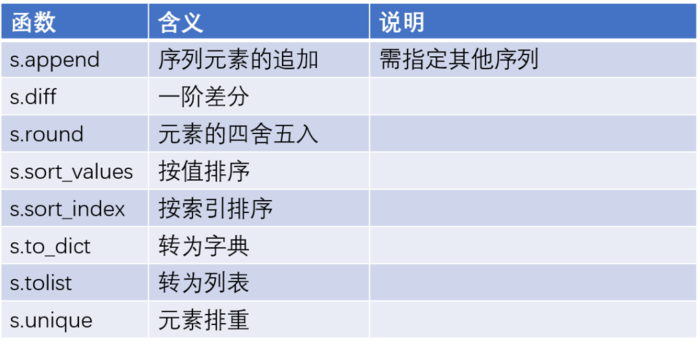
importnumpyasnp
importpandasaspd
np.random.seed(112)
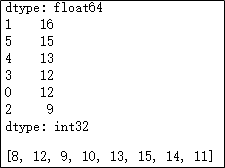
x = pd.Series(np.random.randint(8,18,6))
print(x)
# 对x中的元素做一阶差分
print(x.diff())
# 对x中的元素做降序处理
print(x.sort_values(ascending =False))
y = pd.Series(np.random.randint(8,16,100))
# 将y中的元素做排重处理,并转换为列表对象
y.unique().tolist()